
Ingestion and pipelines
Batch and streaming ingestion from POS, ecommerce, ERP, CRM and partner feeds, with schema handling, retries and alerting that names the failing source.
Dashboards nobody trusts and AI pilots that stall usually share one cause. We build the pipelines, models and governance underneath so the numbers agree with each other - and stay that way.
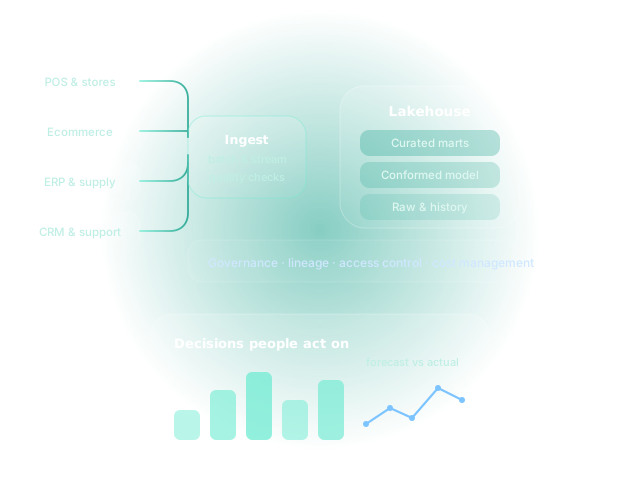
Batch and streaming ingestion from POS, ecommerce, ERP, CRM and partner feeds, with schema handling, retries and alerting that names the failing source.
A layered model - raw history, conformed core, curated marts - so a change in a source system does not ripple straight through to a board report.
One definition of margin, of a return, of an active customer. Written down, version controlled and used by every report instead of re-derived in each one.
Views built for a decision, not for completeness. Fewer charts, each one answering a question somebody named before we started building.
Tests on freshness, volume, uniqueness and referential integrity, running with the pipeline - so problems are found by the platform, not by a director on Monday.
Lineage, access control, retention and a view of what each workload costs to run. Cloud data bills grow quietly until somebody makes them visible.
We do not disappear for six months to build a platform. The first useful output lands early, and the foundation is laid underneath it as we go.
Sources, owners, current reports, the spreadsheets in between, and where the disagreements actually come from. Usually two weeks.
One report or metric that matters enough that its accuracy is worth arguing about. That becomes the first vertical slice through the whole stack.
Ingestion, model, tests, dashboard and documentation for that one decision - built the way everything else will be built.
Each additional domain reuses the same patterns. Speed increases as the shared layer grows, rather than the estate becoming harder to change.
Your team takes it on with documentation and pairing, or we operate it under an agreed support model. Both are fine; drifting into the second by accident is not.
A short engagement that maps what you have, what it costs and what it would take to make the numbers agree. You keep the findings either way.